



See how data annotation for AI in energy helps teams inspect solar panels and wind turbines, review defects, and plan follow-up work.
A solar farm and a wind farm can both produce thousands of inspection images. What your team needs is a shorter list of equipment worth checking. Data annotation for AI in energy helps train models to find relevant features in those images and connect them to specific assets.
The work isn’t the same at solar and wind sites. A hot spot on a panel needs different labels than a mark on a turbine blade. Looking at those differences makes it easier to decide what your monitoring model should learn and what still needs an engineer to review.
Define Annotation Tasks for Solar and Wind Sites
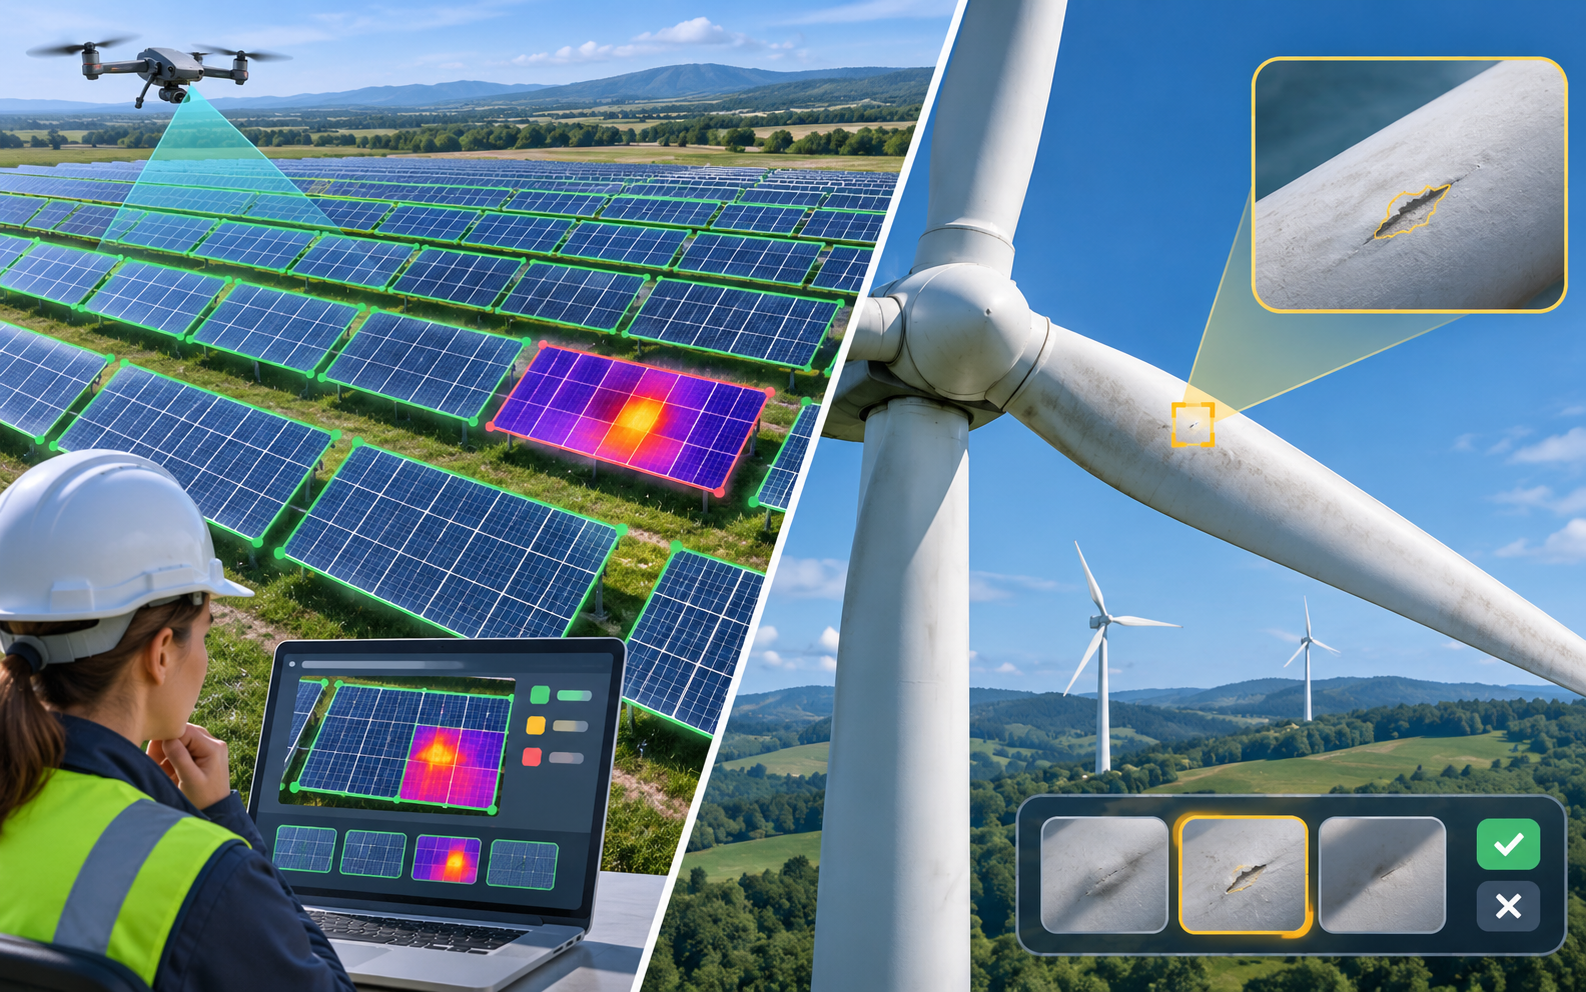
Solar monitoring often starts with lots of similar, repeated objects. Your model may need to find each module, separate it from the ones next to it, and classify a visible or thermal pattern. The repeated layout makes comparison easier, but it also makes location mistakes easy. A correct finding attached to the wrong row sends a technician to the wrong place.
Wind turbines pose a different image problem. One side of a blade looks different from the other, and a surface mark might take up only a few pixels in a wide shot. Reviewers need enough detail to tell a suspected defect from dirt or a shadow.
Renewable energy AI depends on how clearly these tasks are defined. “Find damaged equipment” is too broad to guide reviewers. “Mark visible areas of blade surface erosion” gives them a specific feature to look for. Your engineering team can then decide how that observation affects the inspection report.
Expert data annotation for AI in energy supports this preparation by turning site imagery into task-specific examples. The label set should follow the equipment and inspection question, with a separate way to record uncertain views.
Label Thermal Patterns for Solar Panel Inspection
Thermal images reveal temperature differences across solar modules, but similar patterns can have different causes. A hot area may indicate an equipment problem without identifying the fault behind it. Your solar panel inspection dataset should reflect what reviewers can actually observe.
Define categories for visible patterns, such as localized hotspots or uneven heating. Include normal modules and examples where shadows or poor image quality make interpretation difficult. If reviewers can't confidently identify a pattern, they should be able to flag the image for further inspection.
A Pattern Is Different From a Diagnosis
A hot region doesn't necessarily mean a specific component has failed. Engineers may need electrical measurements, maintenance records, or another inspection to determine the cause. Some defects also produce no detectable temperature difference under the conditions in which the image was captured.
Keep the observed thermal pattern and any confirmed diagnosis as separate fields. This allows models to learn recognizable features without treating every similar-looking area as evidence of the same fault. It also prevents a lack of visible anomalies from being mistaken for proof that a module is healthy.
The Module Needs an Address
Keep the site and module identifier with each labeled image. When the same panel shows up in several frames, all those views should point to one asset.
Otherwise, your model might correctly spot the same issue several times, and the report will count it as several faulty panels. Annotation can support the matching, but your reporting software also has to combine repeated observations.
Annotate Wind Turbine Blades Across Inspections
In wind turbine monitoring, labels often describe surface condition. A reviewer might outline visible erosion or mark a suspected crack for a closer look. The annotation instructions should spell out which features count and how to handle blurry edges.
Blade position matters as well. A close-up of the leading edge and a distant shot of the whole blade answer different questions. Keep that context with the label so the model team knows what each example represents.
Picture a turbine photographed twice, several months apart. A larger marked area in the second inspection could mean the damage has grown. It could also mean the camera was closer. Comparing the two takes a reliable match to the same blade region and enough information about image scale. A useful record includes:
• The turbine and blade identifier
• The observed side or region of the blade
• Capture date and usable image detail
• The visible condition and any review uncertainty
These fields help reviewers compare evidence across visits. They also lower the chance that a change in photography turns into a false change in equipment condition.
Test Renewable Energy AI on Unfamiliar Images
Your test set should reflect the footage your team will really collect. A model trained mostly on sharp close-ups may struggle with routine shots taken from farther away. Solar imagery also varies with reflections and shading, and blade images can have cluttered backgrounds.
When splitting data, keep images of the same asset and inspection visit together. If near-duplicate frames end up in both training and testing, performance will look better than it will at a new site.
Evaluate normal equipment as carefully as suspected defects. False alerts create review work, and a model that flags too many ordinary images can bury the findings your team actually wants.
Keep image quality separate from equipment condition, too. “Unusable view” isn’t the same as “no defect.” Recording that difference tells the capture team where another image is needed, instead of giving the asset a clean result it hasn’t earned.
Connect Inspection Findings to Maintenance Decisions
Renewable energy analytics is most useful when a finding includes enough context for someone to act on it. A reviewer needs the original image, the asset location, and a clear description of what the model flagged.
Leave repair decisions out of the visual label unless qualified reviewers have supporting evidence. Two defects that look alike can have different priorities depending on where they are or the asset’s service history.
Once a technician checks an alert, record what they found. Confirmed findings can improve future training examples. Rejected alerts can point to a confusing category or a type of ordinary image the dataset is missing.
Bottom Line
A good monitoring model gets your team to the right equipment with a clear question. Specific labels and reliable asset matching make that possible at both solar and wind sites.
Before expanding coverage, follow a few alerts from image capture through field review. If the reviewer can find the asset and understand the evidence, you’ve got a workable process to build on.
Related Posts
- Top Advertising Agencies in 2027: Best Global Firms & How to Choose
- How Mobile Apps Are Revolutionizing the Real Estate Industry
- How Data Annotation for AI in Energy Improves Renewable Energy Monitoring
- How-To guide: Set up domain and hosting for your Magento 2 store
- How to Match Your Phone Case to Your iPhone Color
- The Best Medical Virtual Receptionists and Answering Services (2027 Guide)